Visibile
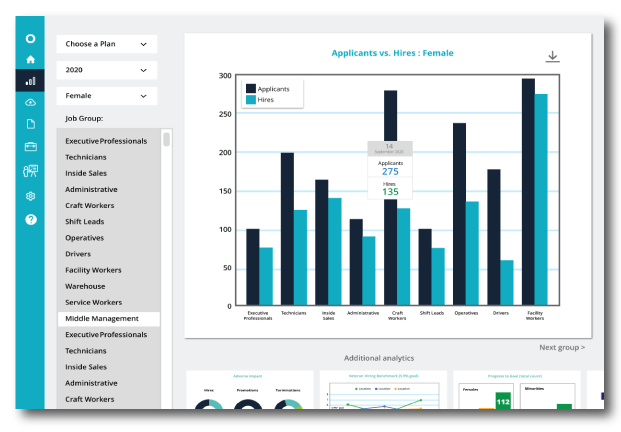
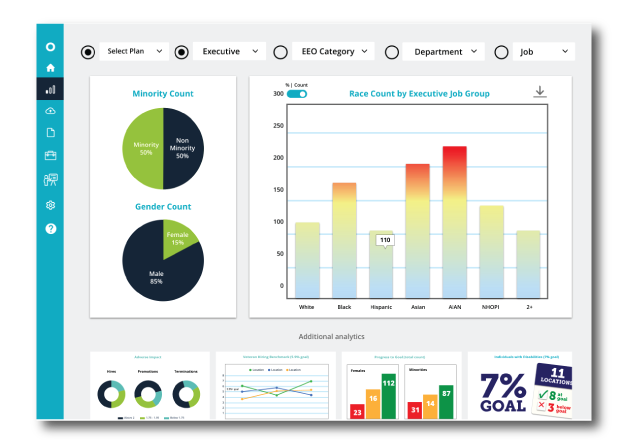
Gain great visibility into your AAP data from one centralized location.


At-a-Glance Visibility Into Your AAP Metrics
.png?width=251&name=15-inch-macbook-pro-retina%20(4).png)
Expanded reporting is available through OutSolve’s online dashboard, in addition to a graphical report package which can be added to any client Affirmative Action Plan or used as management reporting. These new reports add color and act as an excellent visual aid for training and sharing.

Advantages of OutSolve's AAP Dashboard: